Approach to Dashboards
- Real-time
- Drill-able
- Thoughtful
- Empower managers to ask good questions
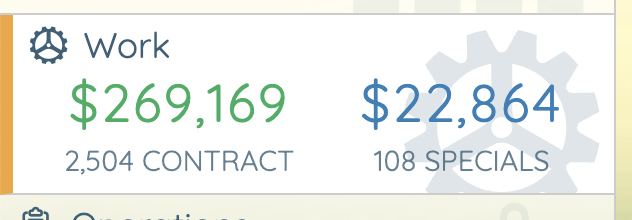
Work
Provides a real-time glimpse into how much 'work' is getting performed:
Today:
This month and this year:
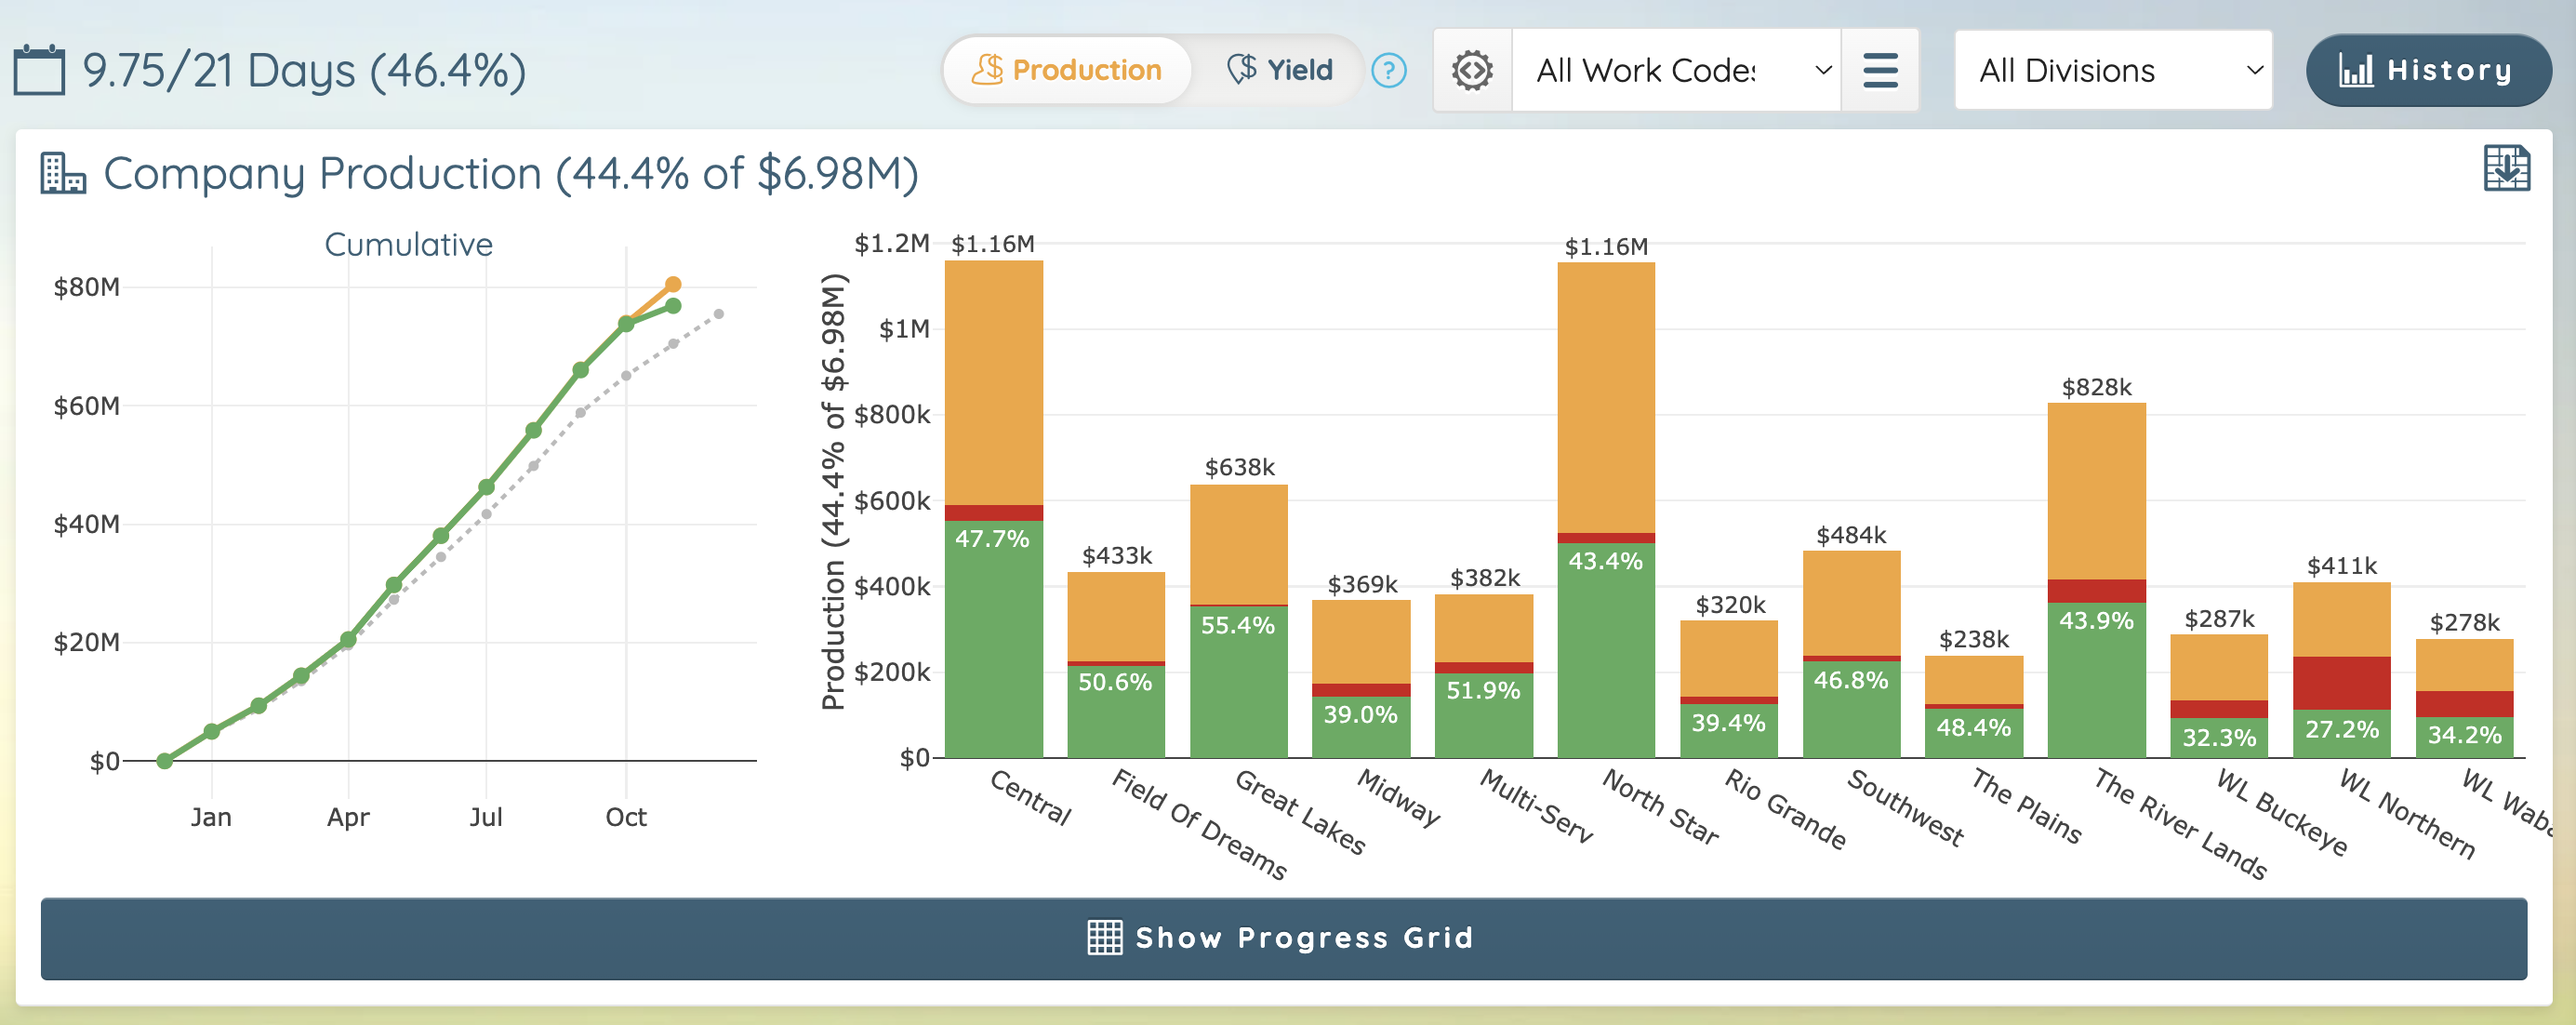
Cumulative Last Year Complete (gray), This Year Complete (green), and This Year Projected (orange)
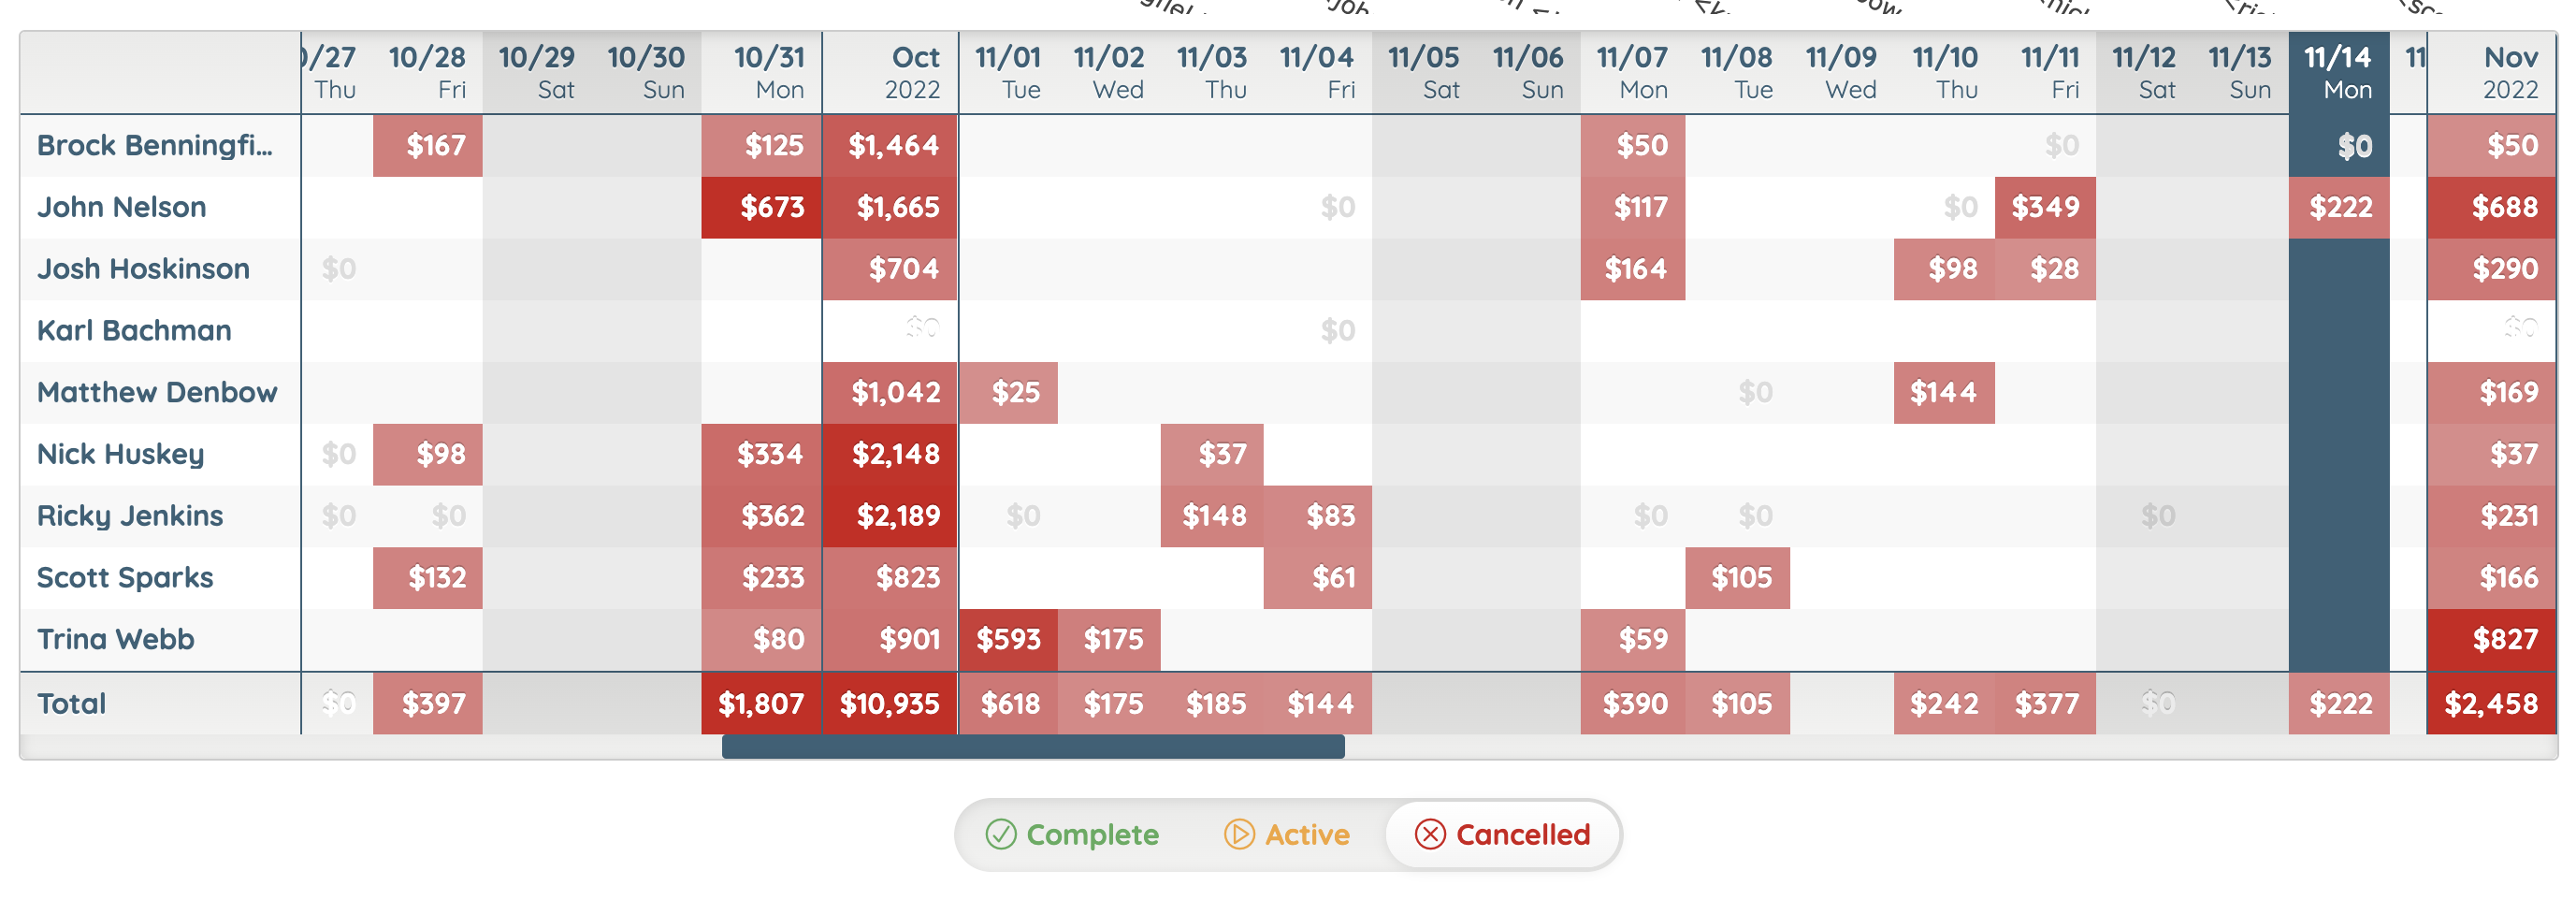
By Region view of work completed (green), active (orange), and carried over from previous month (red):
Drill down to Region, Branch, and Technician level:
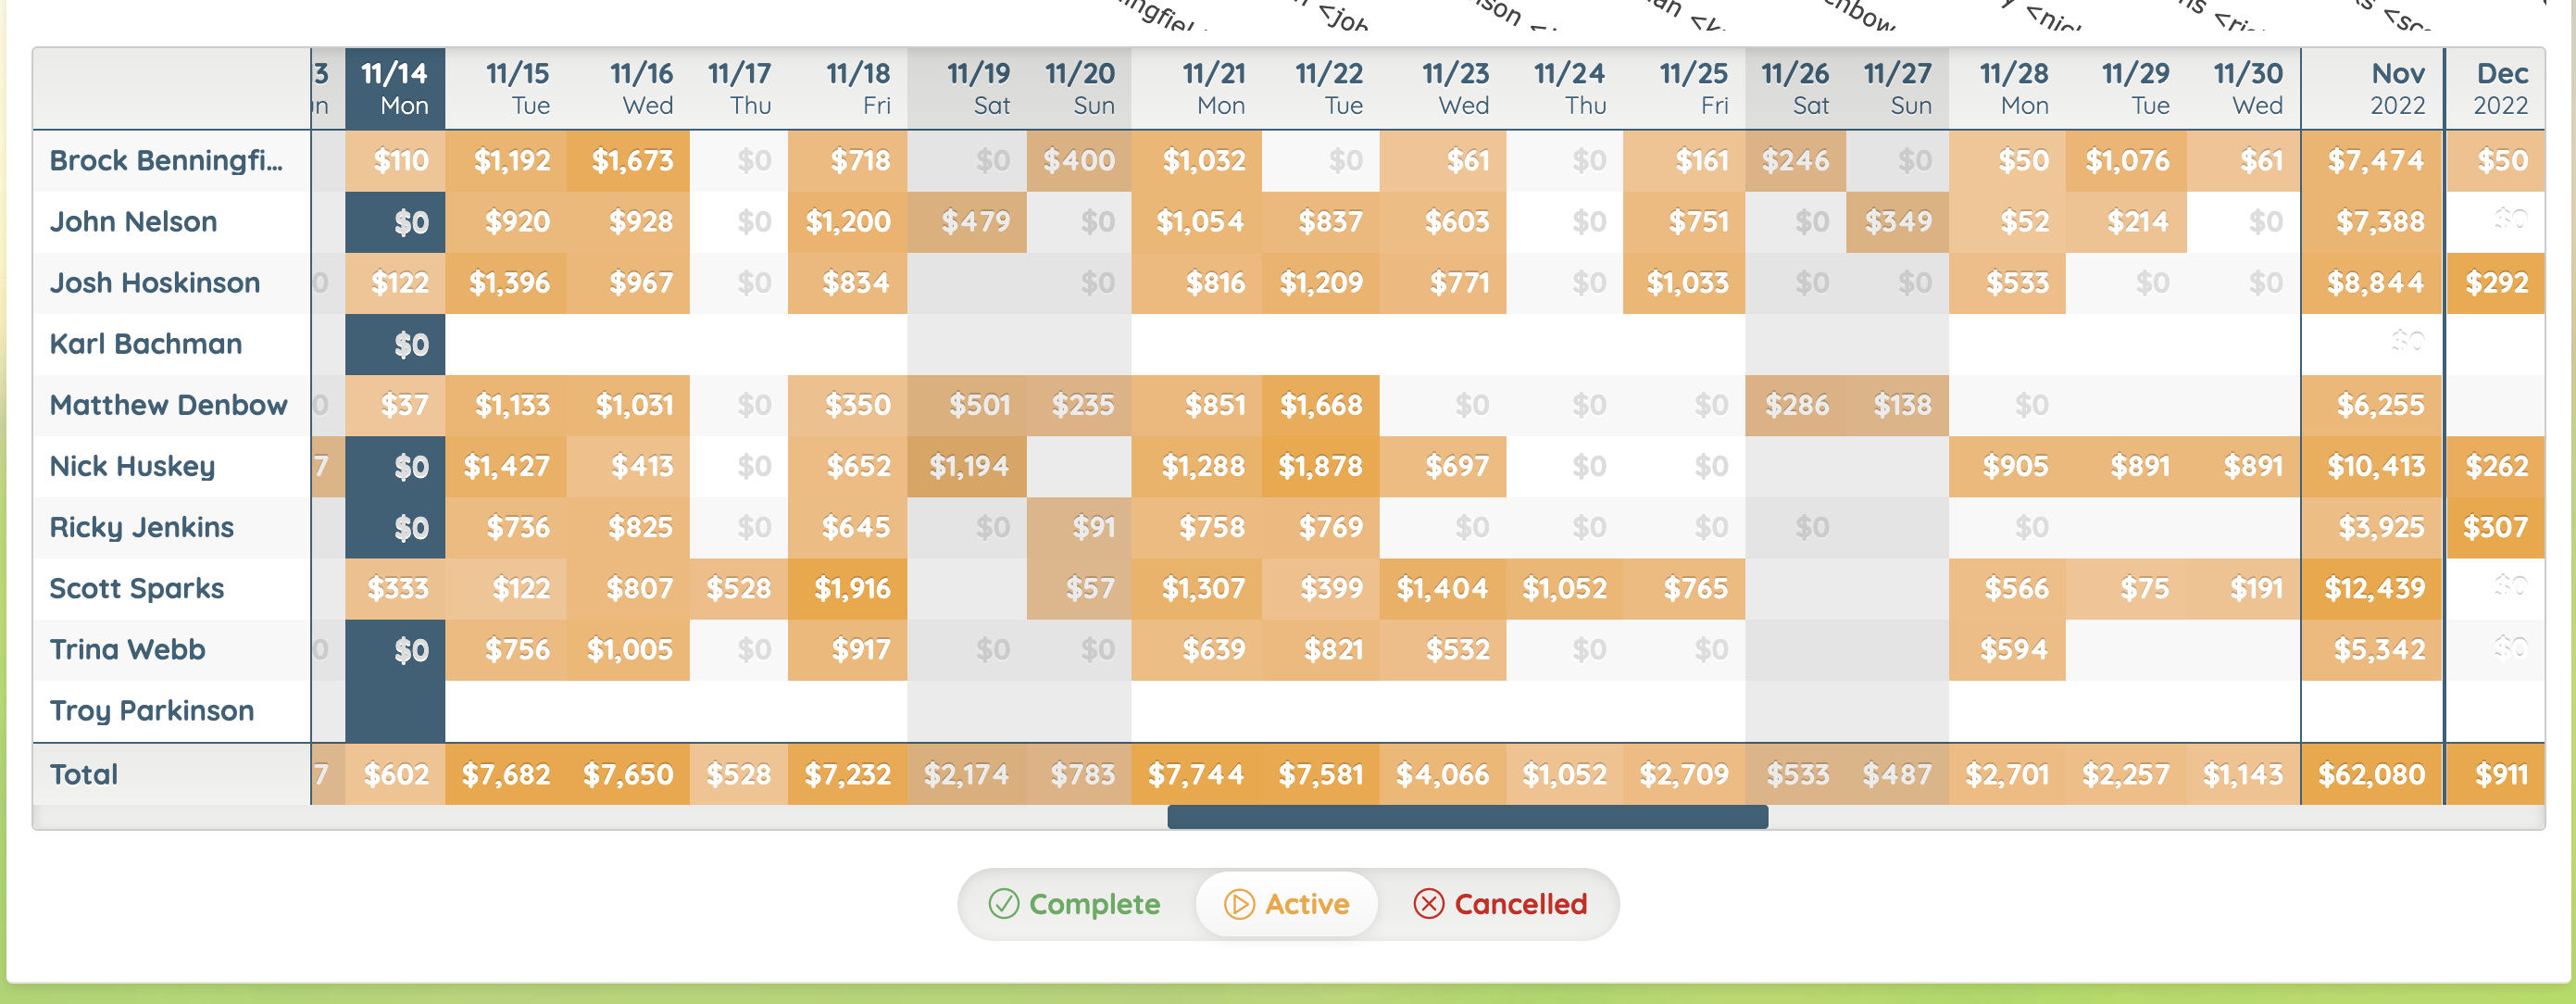
View tech work by day and drill down to the Service Report:
Filter by Active and Cancelled:
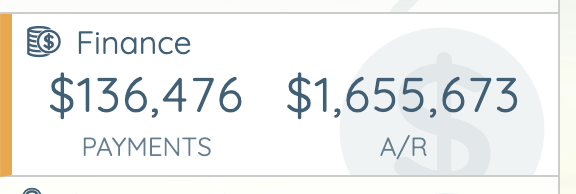
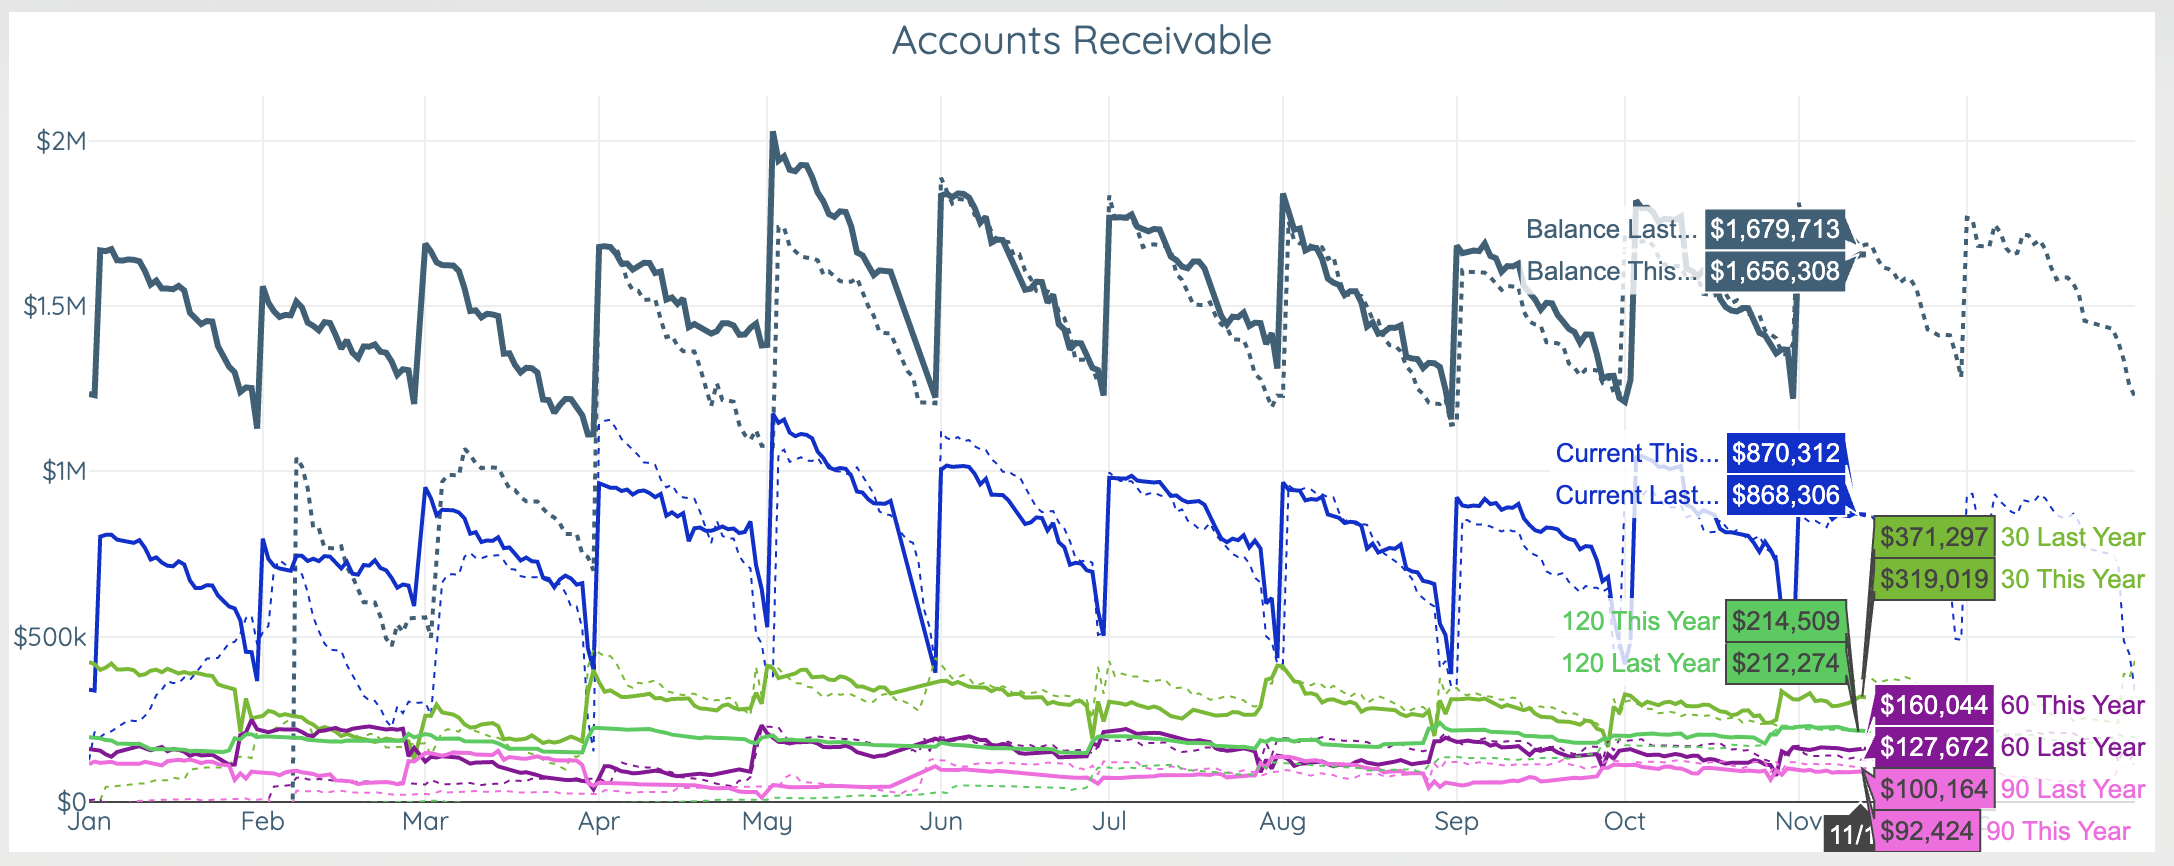
Finance
Provides a real-time view into today's Payments received and current AR:
Especially for companies with variability in their production and revenue, a by month view is insightful:
AR balance by day by aging bucket:
Gain-Loss
A core KPI of pest control: the measure of Gain/Loss on recurring annualized revenue.
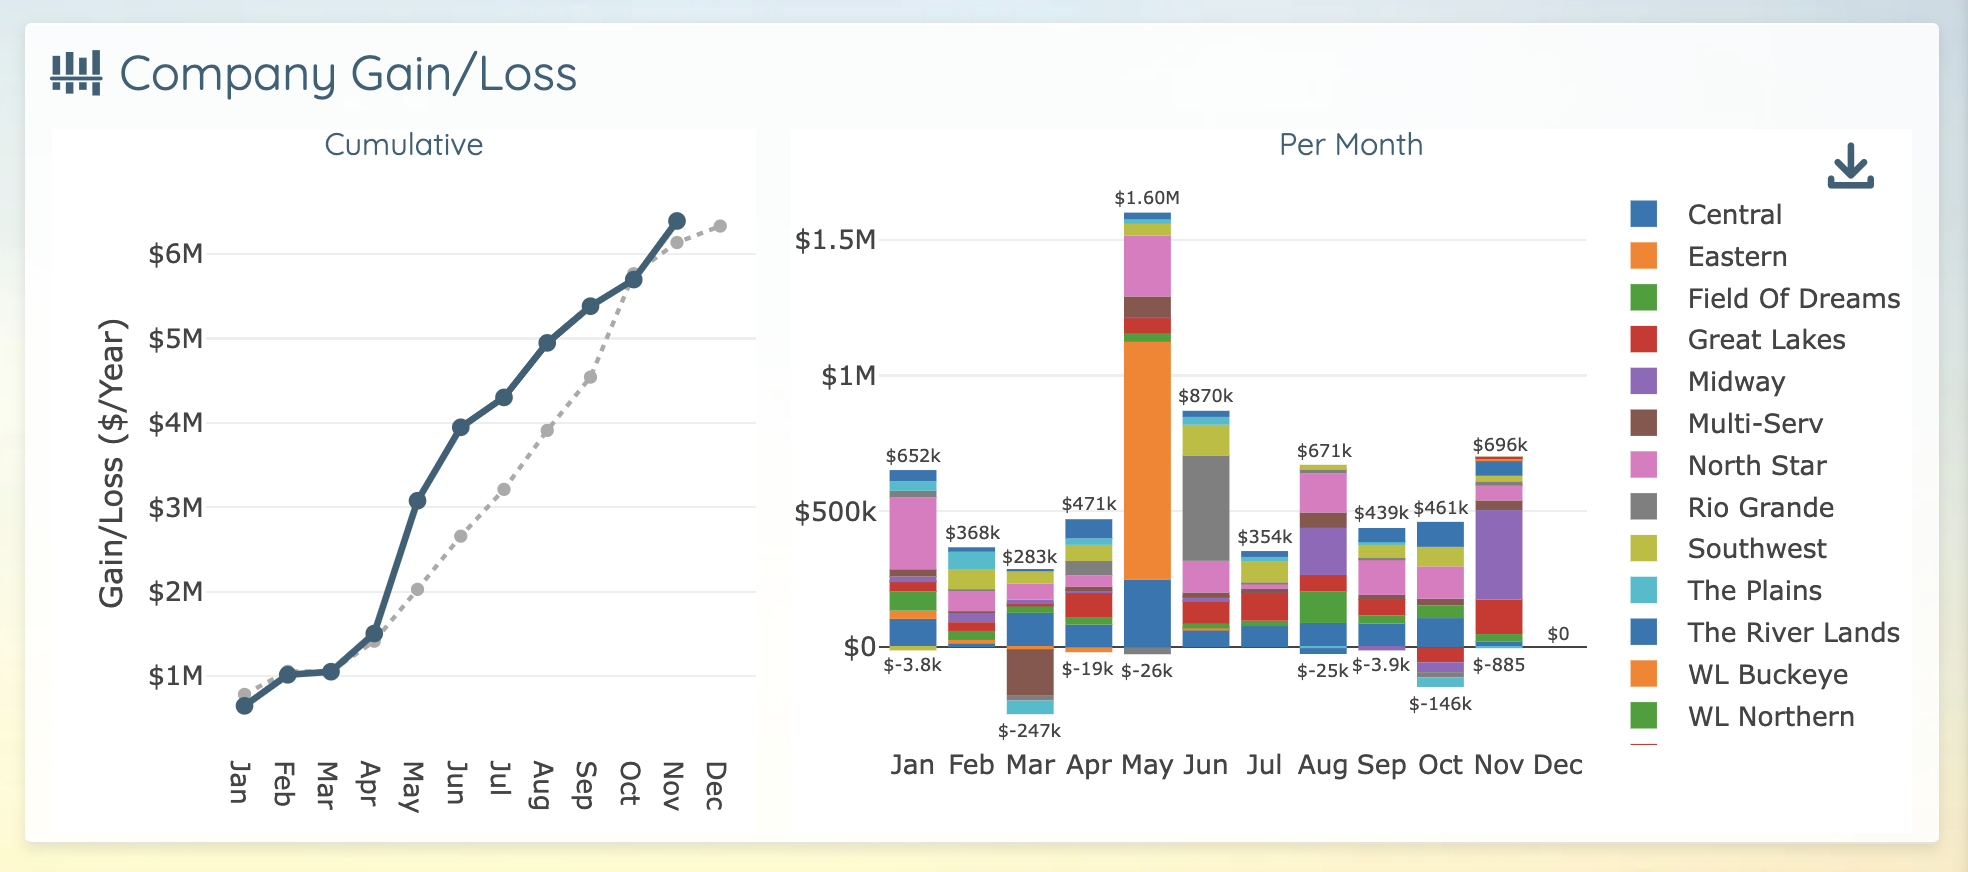
Clypboard enforces the gain/loss metric by ensuring that each change in price or frequency to a setup triggers a gain/loss event (that can be overruled, if necessary).
Company cumulative, by month, compared last year:
By Region (gain and loss):
Regional cumulative and by branch breakdown:
Branch cumulative and by technician breakdown:
Drill-able down to each gain/loss event:
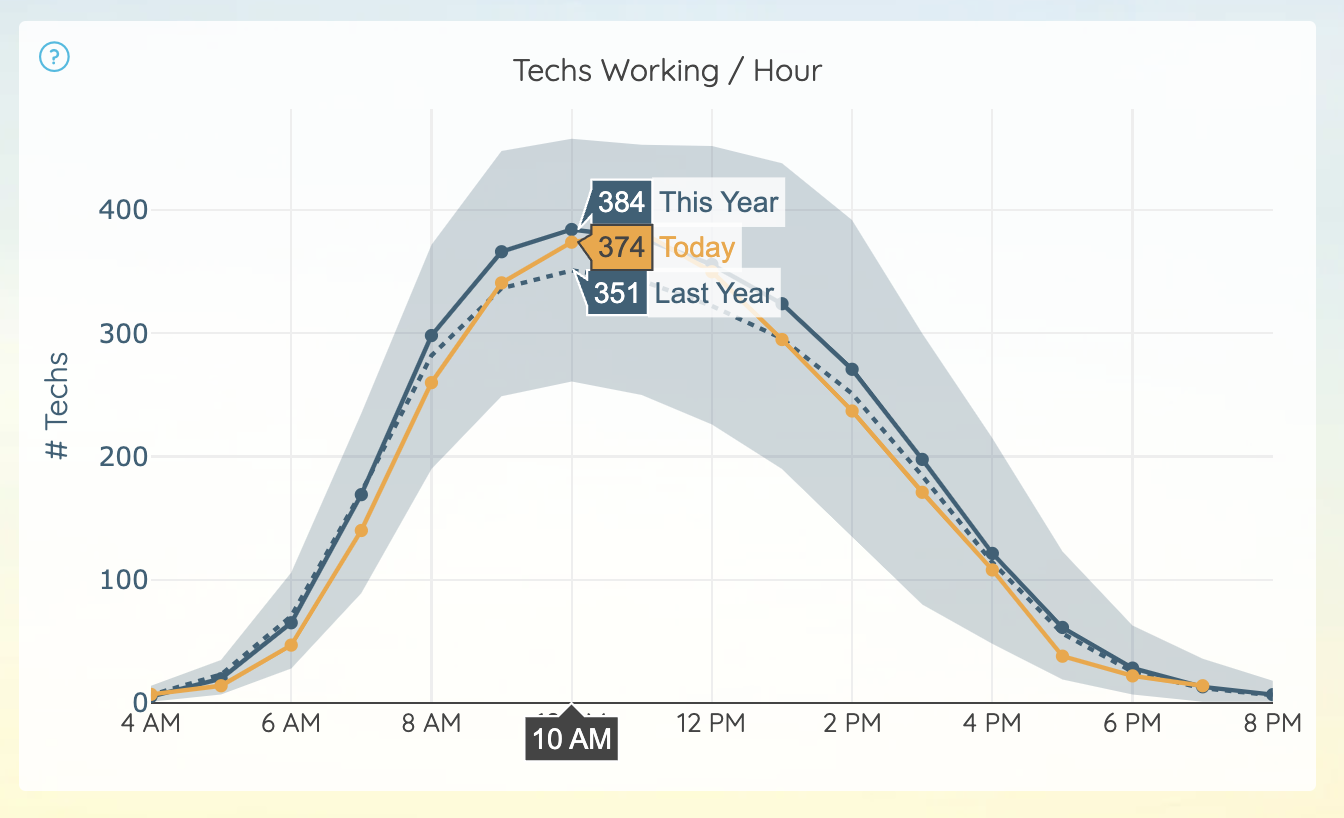
Operations
Techs Working Per Hour - counts the number of users with at least one work orders started, in-progress, or completed during each hour.
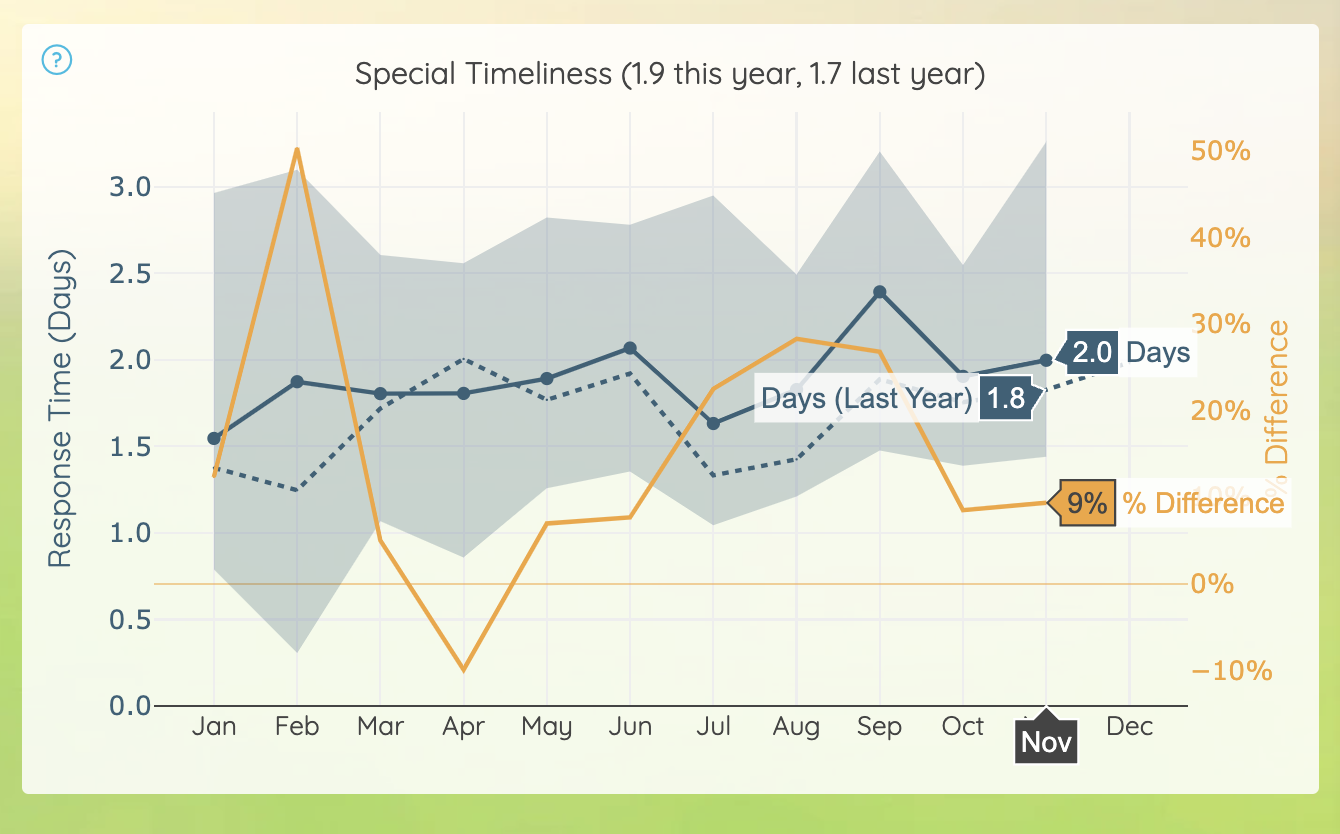
Special Timeliness - days between the originally scheduled time and when the special was actually serviced.
Customer Service
Today's one-time (special) and callback orders:

By CSR interactive view of production for the day:
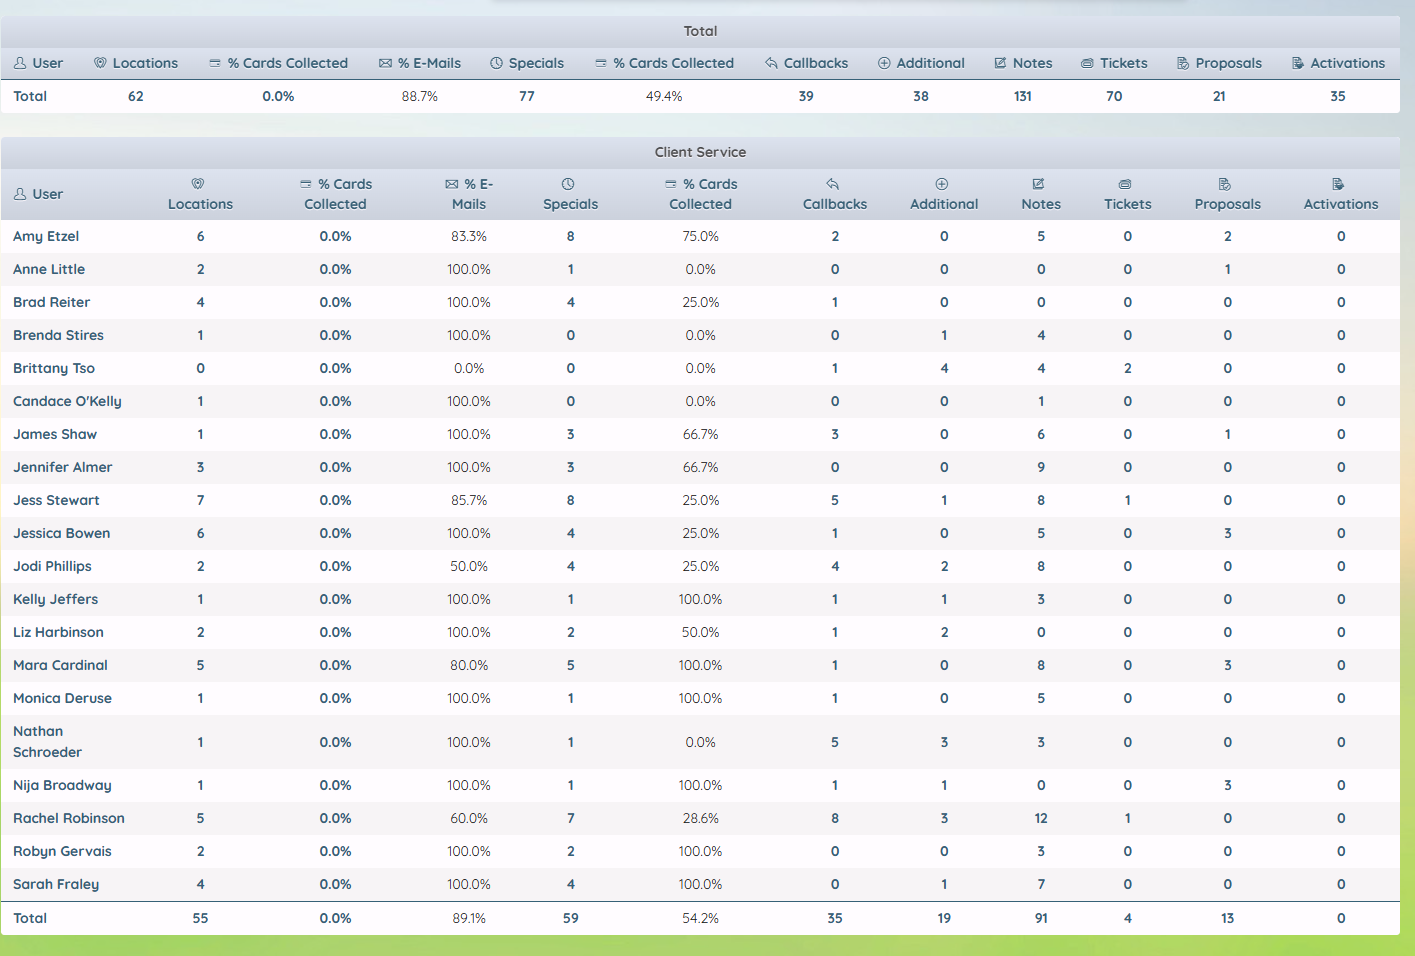
Click to view the list that makes up the count: